The methodology
The 3PL Operating System.
Five steps in order: See It, Map It, Score It, Light It, Oversubscribe. Each step has a named tool. Most operators enter at step one or step two and earn the next from the savings the last one created.
We made this up. Chuck has been on warehouse floors for twenty years; Steven has twenty years of software development behind him — runs and consults to companies that live on WMSes every day. Between them, every major WMS the market has shipped has been on the operating table from one side or the other. The five steps below are what kept showing up.

Chuck Feldman & Steven Sharp — the operating system is theirs.
At a glance
See it. Map it. Score it. Light it. Oversubscribe.
-
01 — See it
DockSnap
docksnap.io
Photo evidence at the dock. Tagged to the WMS record. The proof your client asks for at 9am.
-
02 — Map it
Warehouse Heatmap
3plheatmap.com
Hot zones, dead zones, slotting moves ranked by labour-hour savings.
-
03 — Score it
Client Scorecard
3plscorecard.com
Per-client portal. Per-client login. The QBR pack builds itself.
-
04 — Light it
Hardware
Pick-to-light · put walls
Banner Engineering hardware, our controller. A day per zone, DIY install.
-
05 — Oversubscribe
The compound effect
The whole stack
Run more clients through the same building. The arithmetic of all four together.
01 — See it
The photos your team already takes — in one searchable library.
You can’t fix what you can’t see. A carton arrives crushed. A picker ships the wrong colour. A driver swears the pallet was fine when it left. Three weeks later the chargeback lands, and your defence is somebody’s word against somebody else’s memory. DockSnap turns the photos your team is already taking into a structured, searchable archive — auto-indexed by shipment ID, BOL, client, and dock door — on the Android handhelds, Android scanners (Zebra, Honeywell), and iPhones they already carry. Offline at the dock, syncs on reconnect. Three taps from a phone call to proof.
Done when you can answer “where is X right now?” in sixty seconds, every time.
Visit the DockSnap site
02 — Map it
Your pick history, drawn over the floor plan.
Now lay it out spatially. You slotted aisle 4 in August. Since October the picker has been walking past three hot SKUs to grab the one she needs. 57% of picker time is walking; the first-pass re-slot typically gets 18–34% of it back. Heatmap reads pick history from your Camelot directly — or from CSV out of any other WMS — and renders an interactive 2D and 3D map of your facility. Hot zones glow red, dead zones sit grey, and every potential SKU move is ranked by estimated labour-hours saved per week.
Done when a stranger can stand at your dock door and see where the work is.
Visit the Warehouse Heatmap site03 — Score it
You priced what they said. Scorecard tracks what they did.
Every 3PL signs in good faith. Then orders climb, picks change, storage stretches — and nobody has a document that compares the quote to reality. Scorecard captures the activity profile a client promised at signing — units in, units out, storage SKUs, value-adds, exception bands — then reads actuals from your WMS month by month. It produces a one-page scorecard per client with traffic-light flags benchmarked to your own warehouse, a live portal each client can log into, and the margin-impact view that tells you which accounts have drifted into the red. Renewals start with proof, not feelings.
Done when clients stop asking for reports — because they already have them.
Visit the Client Scorecard site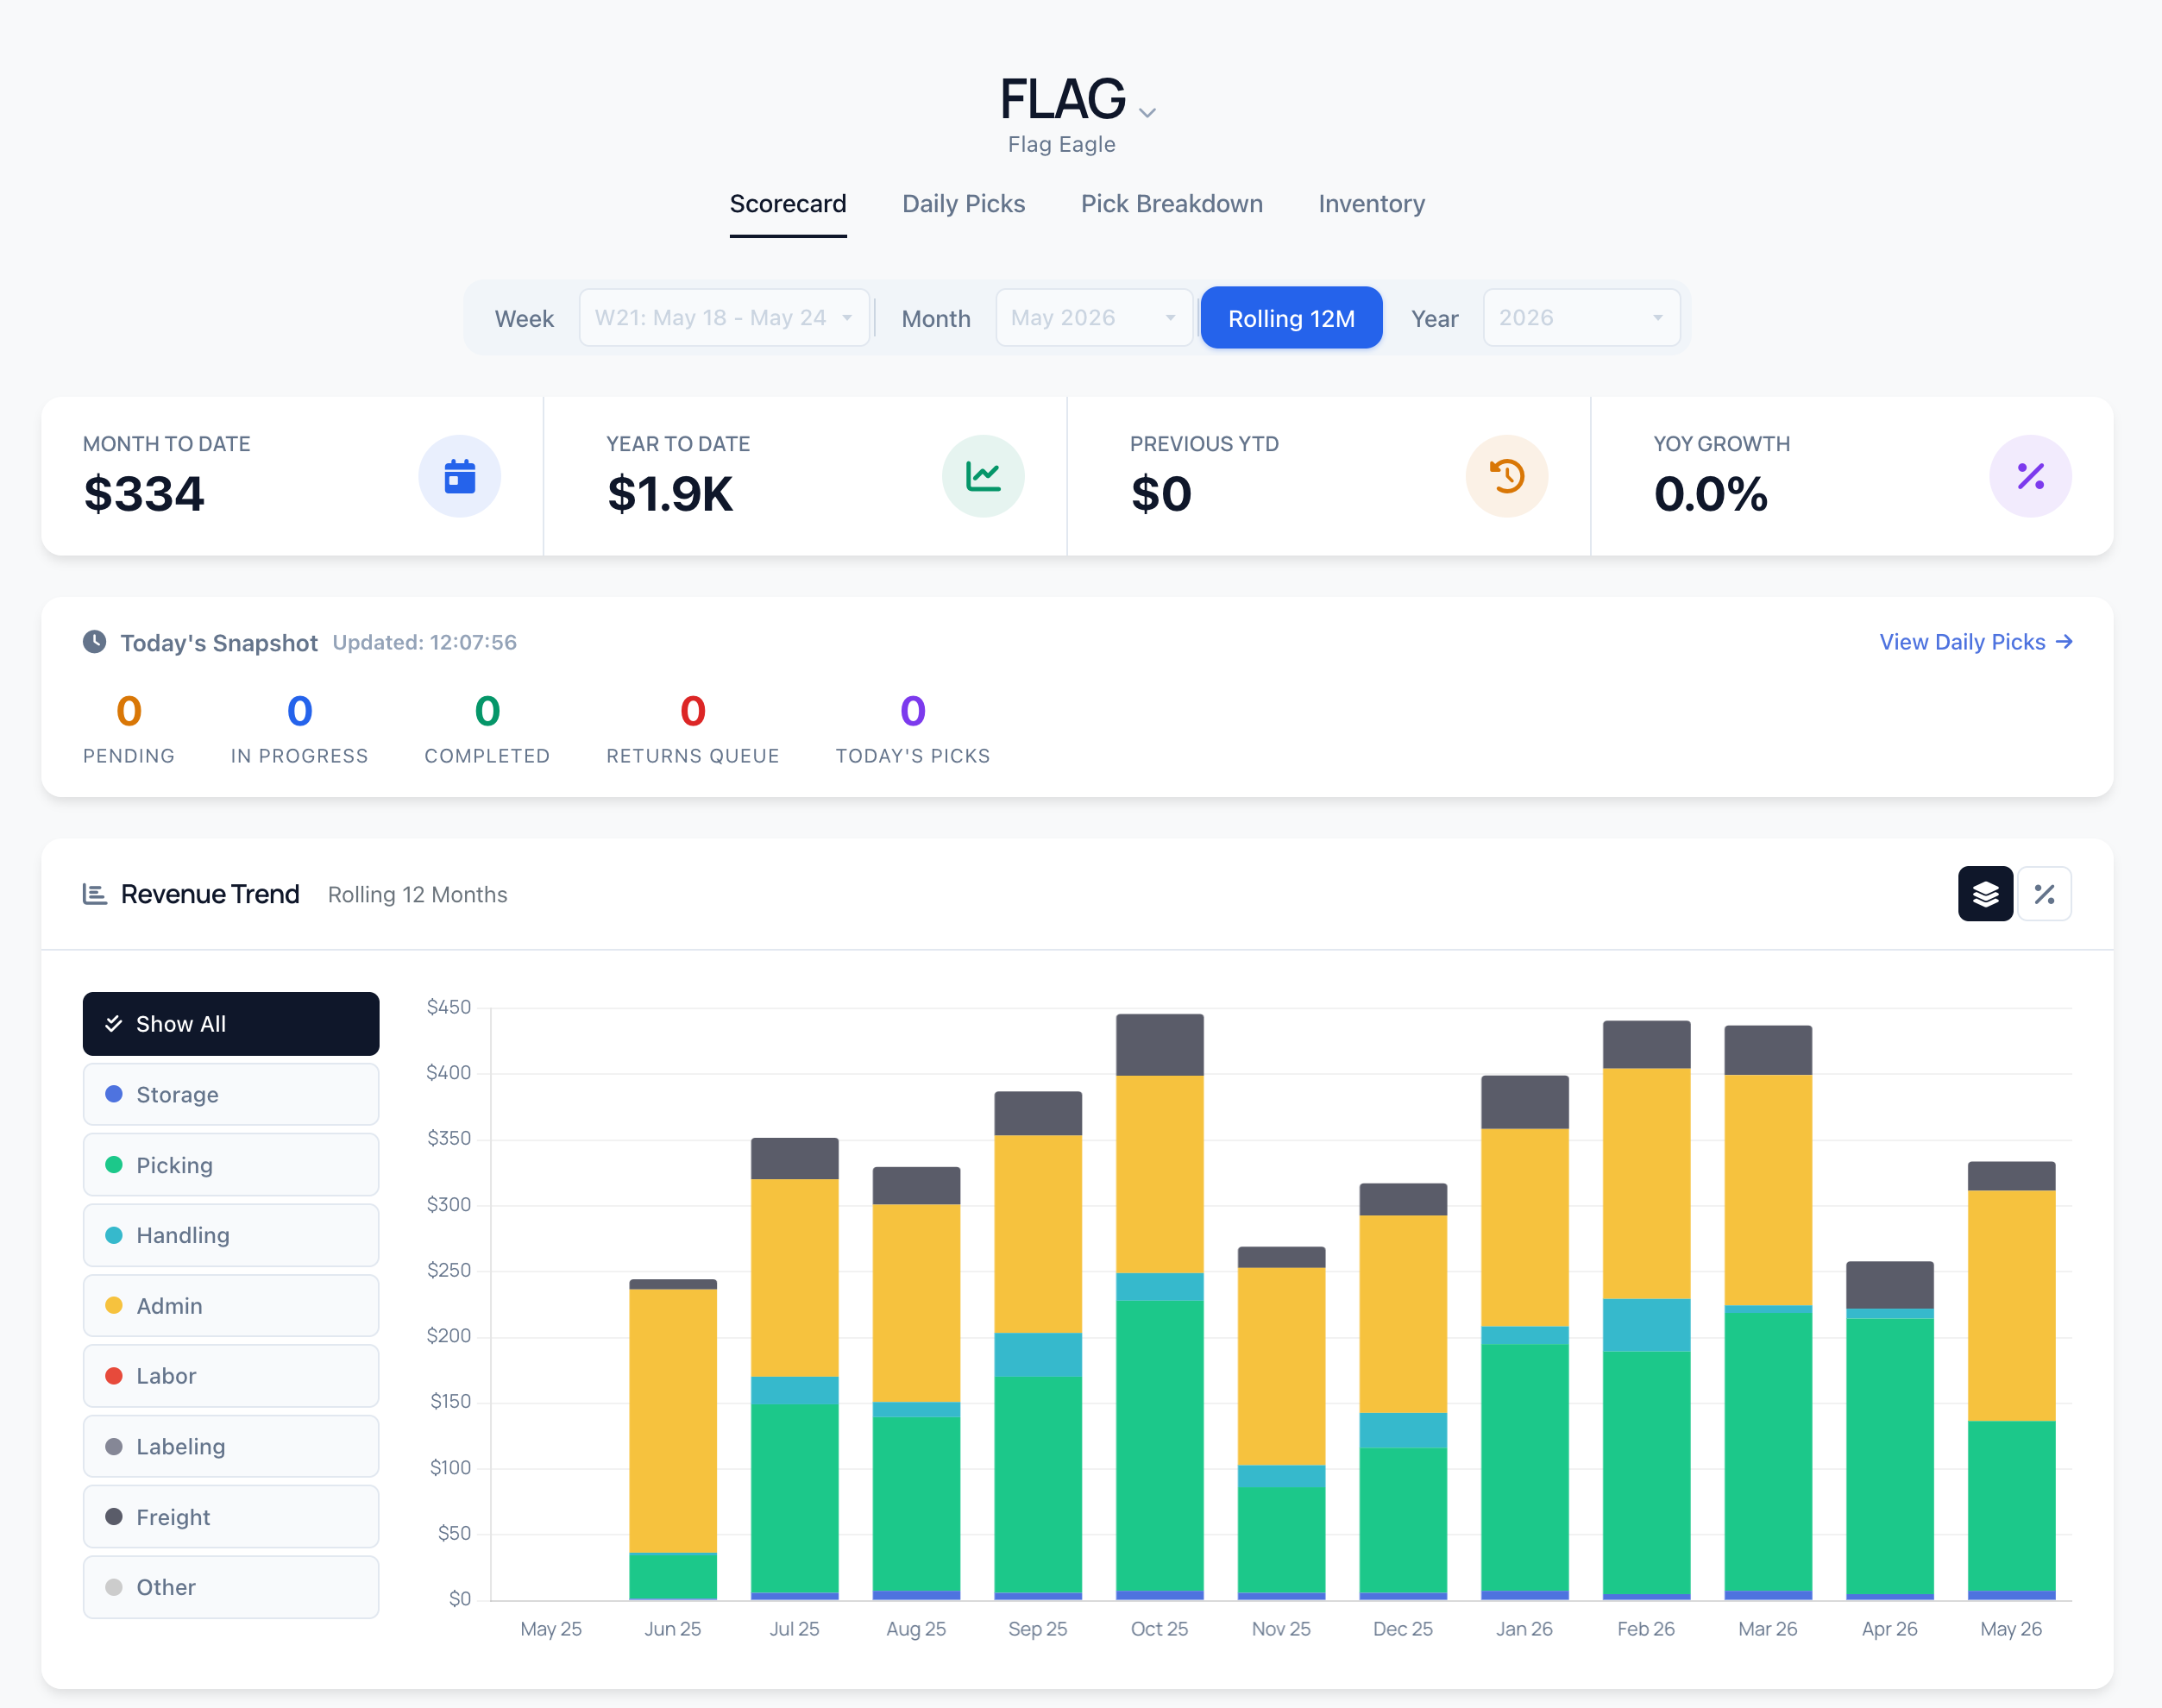
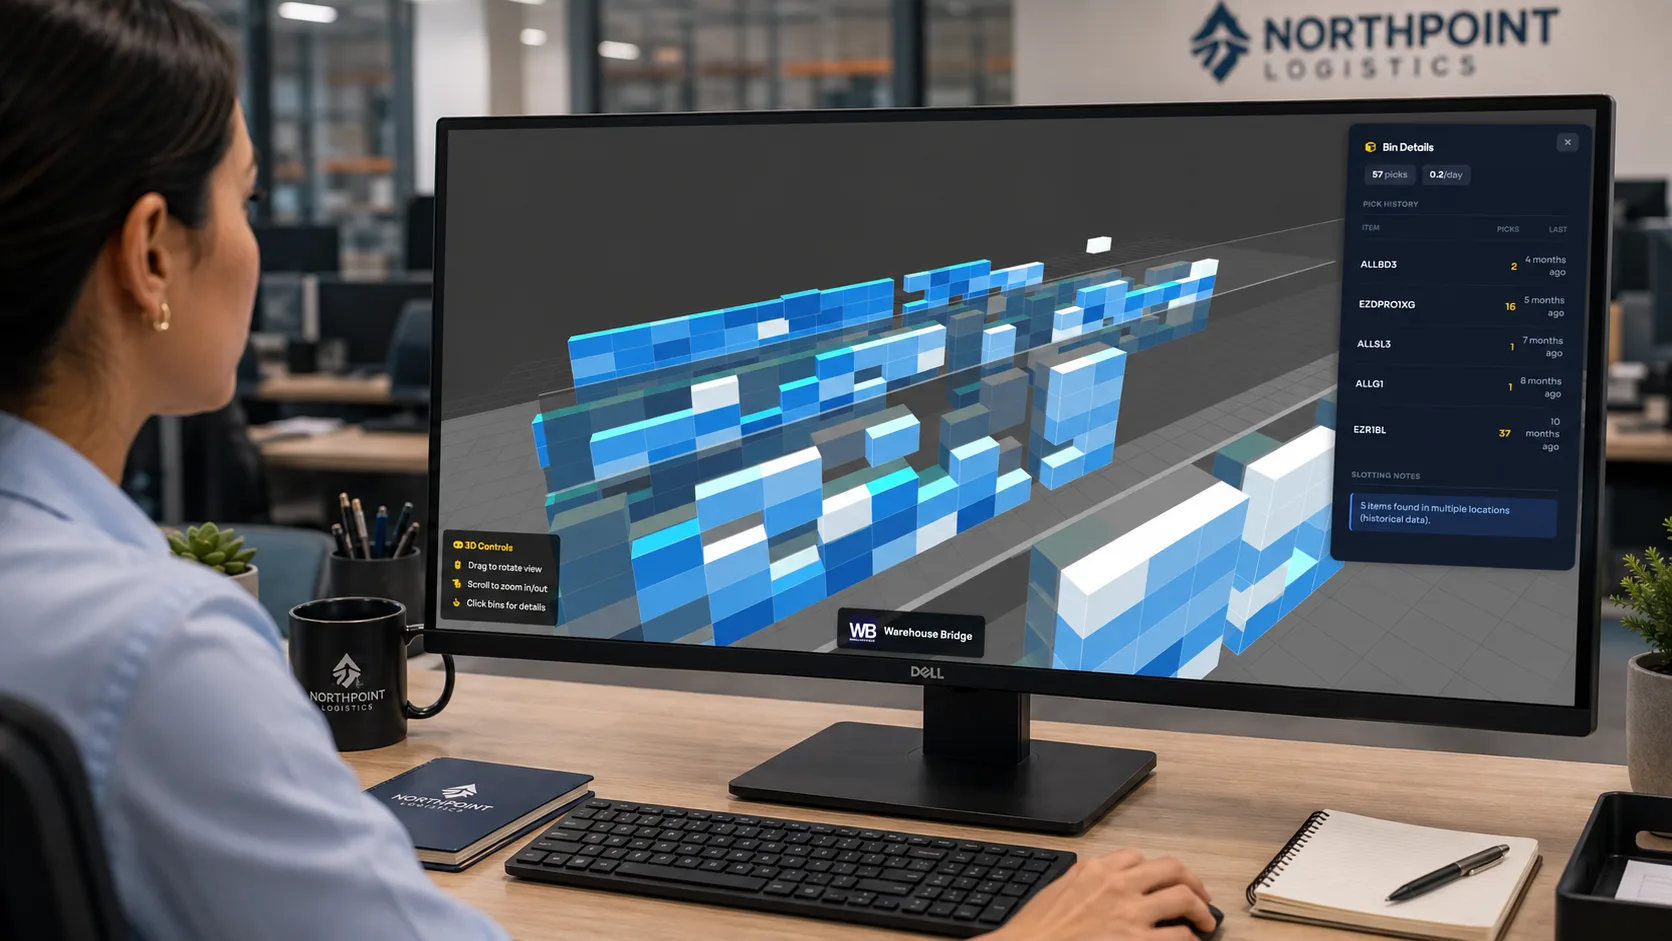
04 — Light it
Pick-to-light, put walls, put-away. Banner builds the lights. We build the bridge.
The eyes are open, the picture is clear, the numbers are scored. Now direct the operator at the point of action. The Warehouse Bridge controller ships pre-configured, talks to your WMS, and drives the Banner gateway in the aisle. The gateway lights up the industrial-grade pick lights at the pick face. Camelot today, plus other WMS on request — you install it yourself in a day per zone.
Done when a new hire is productive in days, not weeks.
See the architecture05 — Oversubscribe
Run more clients through the same building.
Visibility plus slotting plus scoring plus lighting together let you put more SKUs, more clients, more throughput through the same square footage. You stop competing on price and start competing on the proof your numbers carry into a renewal conversation.
Done when you have a waiting list, and the discipline to say no.
Take the 60-second audit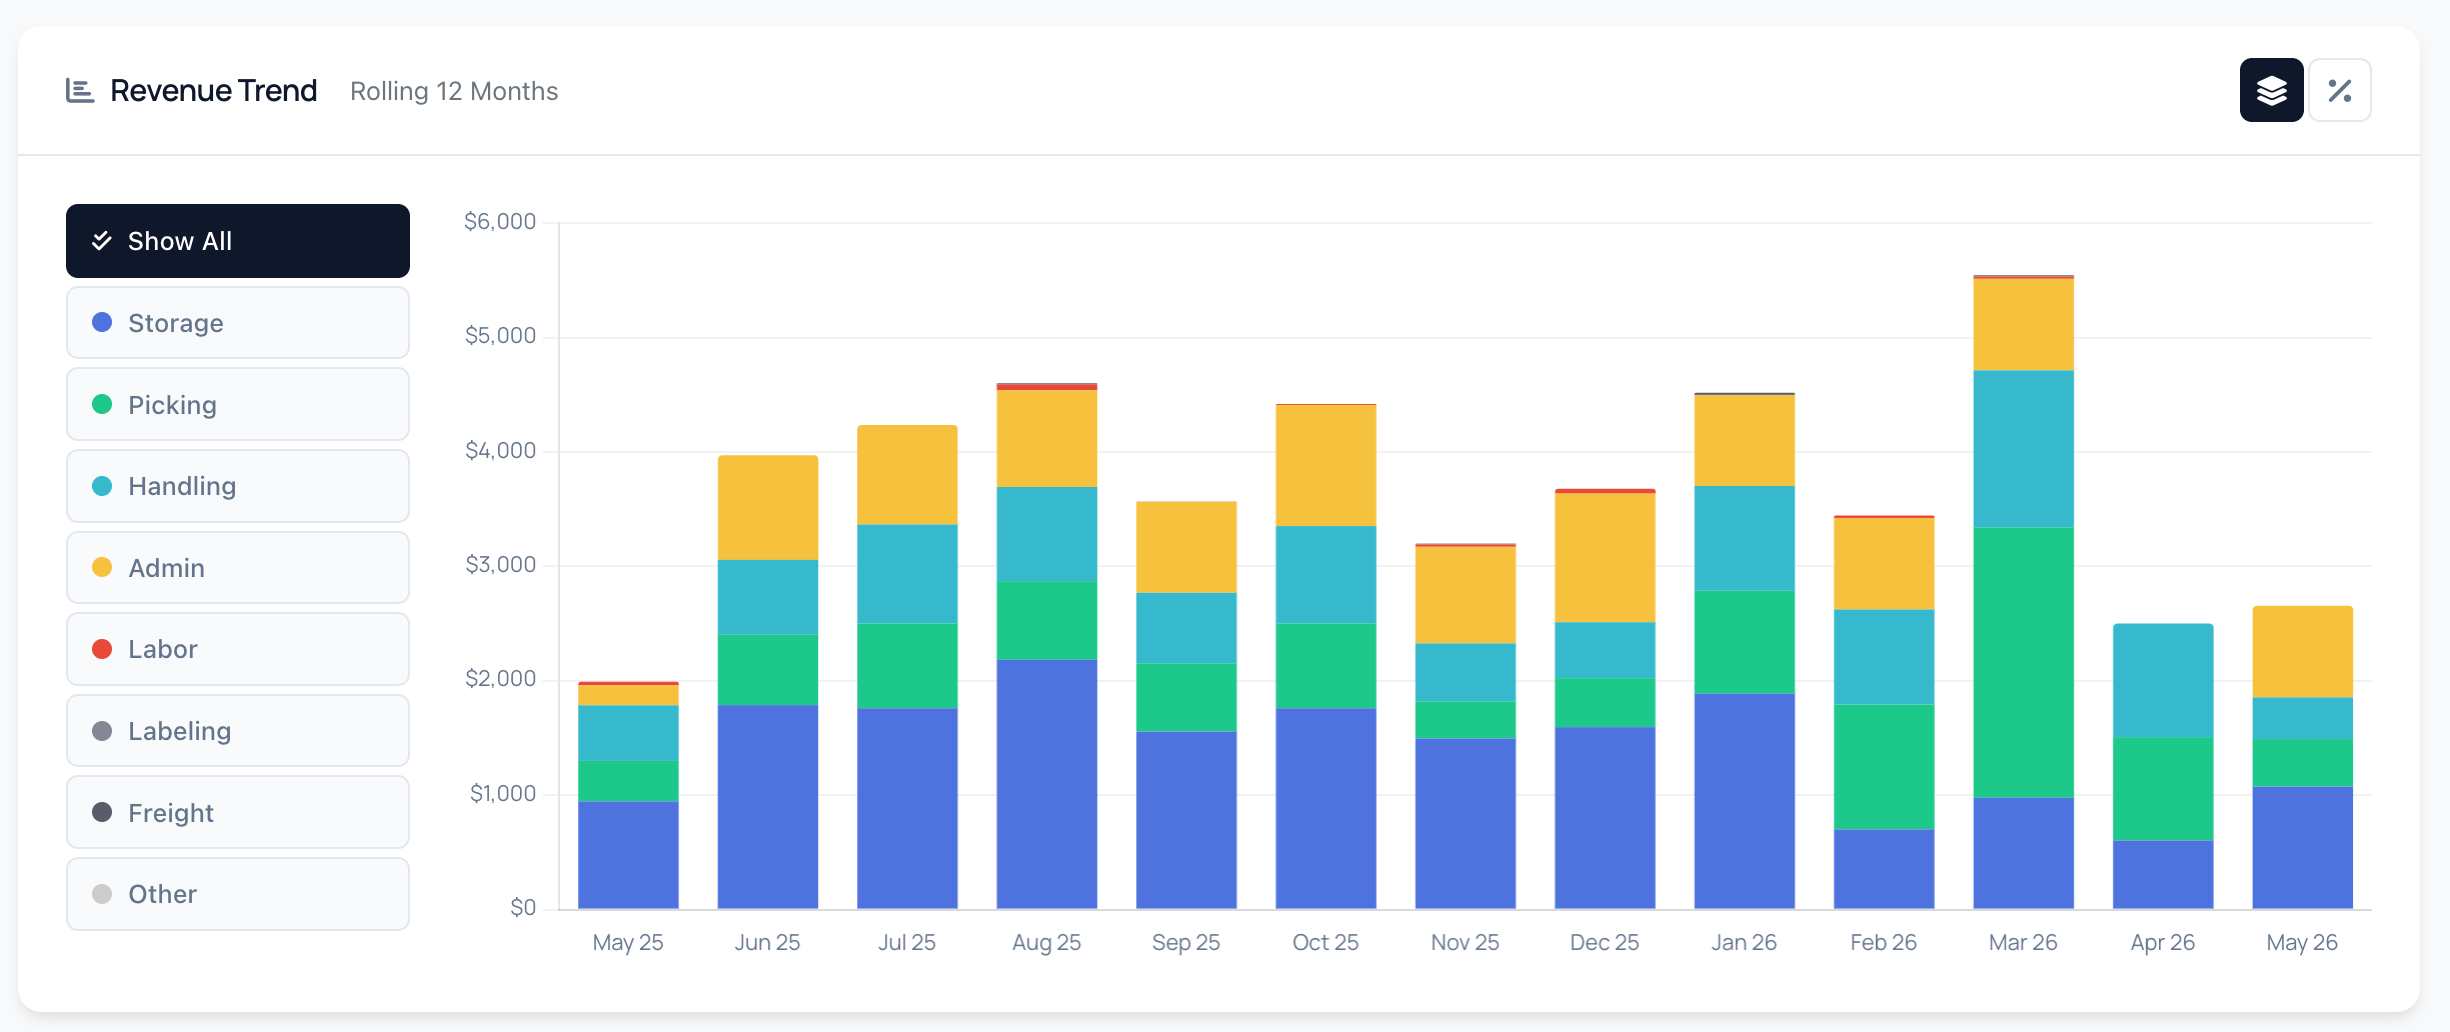
Permission to skip steps
You don’t have to do all five.
Most operators start at step one or step two and earn the next from the savings the last one created. Pick the step that maps to the dimension that’s costing you the most this quarter — or take the audit and we’ll point you at the one to run first.
Take the 60-second audit