Part of Warehouse Visibility Series
Using heat maps for co-location slotting
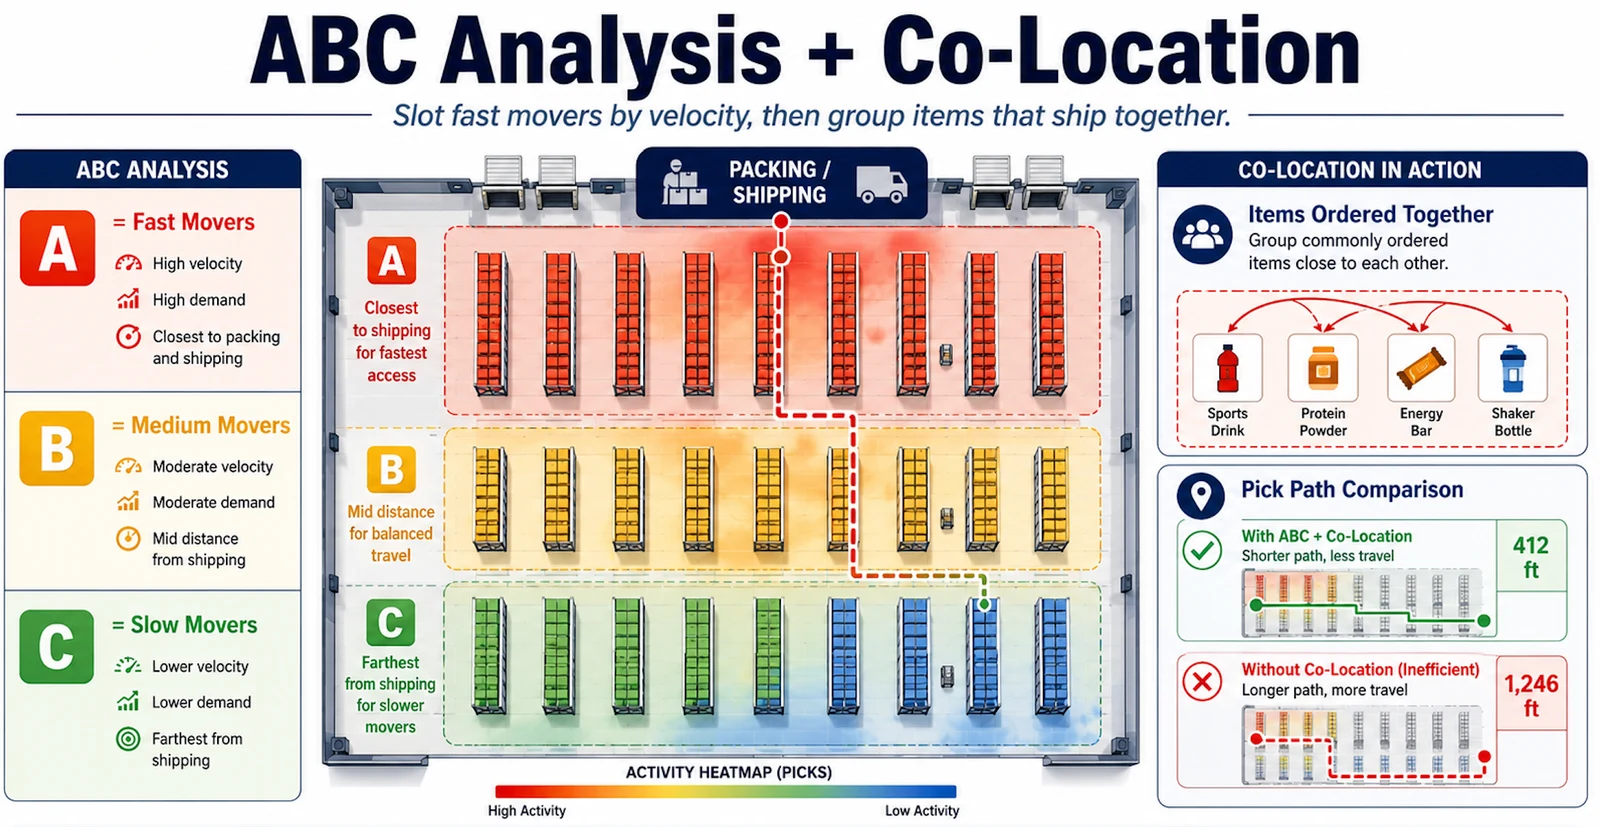
ABC analysis answers which items move the most. It does not answer which items move together. Co-location slotting — surfaced by a heat map — is the smarter layer that turns slotting from a SKU-ranking exercise into a real labour-saving move.
A smarter layer beyond ABC analysis.
ABC analysis has long been one of the most common methods for organising warehouse inventory. The idea is simple: identify your fastest-moving items, place them in the most accessible locations, and reduce the amount of travel required to pick orders.
ABC analysis is valuable. It helps answer the question: which items move the most?
But it does not always answer another important question: which items move together?
That is where heat maps add a powerful new layer to your slotting strategy.
ABC analysis tells you what is popular
ABC analysis ranks items based on activity. "A" items are typically the fastest movers, "B" items move at a moderate rate, and "C" items move less often.
This is helpful because it allows a warehouse to focus attention on the items that create the most work. Fast movers should usually be easier to reach, closer to packing, and placed in locations that reduce unnecessary walking or equipment travel.
However, ABC analysis primarily treats items as individual SKUs. It tells you how often each item is picked, but not how those items relate to one another in real customer orders.
Two items may not be the top movers on their own. But if they are frequently ordered together, separating them across the warehouse creates extra travel, extra handling, and wasted labour.
Co-location slotting looks at what moves together
Co-location slotting focuses on grouping items that are commonly picked together.
For example, a customer may frequently order:
- A cleaning product and replacement pads
- A machine part and a matching seal
- A food product and a related packaging item
- Several SKUs that are often purchased as part of the same kit or project
Individually, each item may not appear important enough to be placed in a prime pick location. But together, they may represent a large amount of repeated travel.
When items are co-located properly, the picker spends less time walking from one area to another. The order becomes easier to complete, and the warehouse becomes more efficient.
Heat maps make the relationship visible
A Warehouse Heatmap gives you a visual way to see activity across your storage locations.
Instead of only looking at reports, spreadsheets, or SKU rankings, a heat map shows you where work is actually happening inside the building. You can identify high-activity zones, underused areas, travel-heavy aisles, and locations creating unnecessary movement.
When used with order history, a heat map can show patterns such as:
- Which locations are picked most often
- Which aisles create the most travel
- Which product groups are frequently active at the same time
- Which items are often part of the same customer order
- Which areas of the warehouse are overworked or underused
This visual layer makes slotting easier to understand. Instead of guessing where the problem is, you can see it.
Why co-location slotting matters
Travel time is one of the largest hidden costs in warehouse operations. Every extra step, turn, aisle change, or equipment move adds time to the order.
When related items are spread across the warehouse, the picker has to travel farther than necessary to complete a single order. Over one order, that may not seem like much. Over hundreds or thousands of orders, it becomes a major labour cost.
Co-location slotting helps reduce that waste by placing related items closer together.
The result can be:
- Shorter pick paths
- Faster order completion
- Less congestion in busy areas
- Better use of labour
- Improved service levels
- Lower operating cost per order
Heat maps add context to ABC analysis
ABC analysis and heat maps should not compete with each other. They should work together.
ABC analysis helps you identify the items that generate the most activity. Heat maps help you understand where that activity happens and how items interact with each other in the warehouse.
For example, an "A" item may be placed in a great location, but the items commonly ordered with it may be stored far away. From an ABC perspective, the item looks correctly slotted. From an order-picking perspective, the layout is still inefficient.
Heat maps expose this problem. They allow you to move from simple SKU ranking to a more complete view of warehouse activity.
A practical example
Imagine a warehouse has three items:
- Item A is picked 500 times per month
- Item B is picked 300 times per month
- Item C is picked 250 times per month
ABC analysis ranks Item A as the highest priority because it has the most picks.
But when you review order activity, you discover that Items B and C are picked together on most orders. They are currently stored on opposite sides of the warehouse.
A heat map shows heavy travel between those two areas. By moving Items B and C closer together, you reduce travel time even though neither item is the top-ranked SKU.
That is the value of co-location slotting. It looks beyond individual item movement and focuses on how orders are actually picked.
Heat maps help start the right conversation
One of the biggest benefits of using heat maps is that they make warehouse activity easier to discuss.
Instead of saying, "I think this area is causing too much travel," you can show it. Instead of saying, "These items should probably be closer together," you can use order activity and visual patterns to support the decision.
This helps warehouse managers, supervisors, engineers, and customers have better conversations about space, labour, and service.
Co-location is not a one-time project
Customer ordering patterns change. Seasonality changes. Product mixes change. New customers are added. Old customers leave. Promotions, kits, and special projects all affect how products move through the warehouse.
That means slotting should not be a one-time event. Heat maps give you a way to review warehouse activity on a regular basis. They help you see when patterns change and when your layout needs to be adjusted.
A good slotting strategy should be active, visual, and based on current data.
The bottom line
ABC analysis is a strong starting point for warehouse slotting. It helps identify which items move the most.
But to reduce travel time and improve picking efficiency, warehouses also need to understand which items move together. Heat maps make that easier to see.
By combining ABC analysis with co-location slotting, warehouse operators can move beyond simple item ranking and begin designing a layout based on how orders are actually picked.
The goal is not just to store products. The goal is to place products in a way that reduces travel, improves labour productivity, and helps the warehouse operate with better visibility and control.
With the right heat-map tools, you stop guessing where items should go and start seeing how your warehouse really works. This sits in Step 2 (Map It) of the 3PL Operating System — the diagnostic step that turns slotting from a vibe into a defensible operational decision.
If you want to know where your operation is bleeding right now, take the 3PL Operating Scorecard — sixty seconds, eight questions, one named tool to start with.
— Chuck & Steven
Want to know which step matters most for you?
Take the 3PL Operating Scorecard. Eight questions, sixty seconds. We’ll show you which dimension is bleeding worst and which named tool to start with.